网页布局
1 概述
Quarto 使用 列(column) 的概念, 提供多种页面元素的布局,例如 正文列body column 、页边距列 margin column 、页面 screen column 等。 如果需要调整这些 column 的宽度, 可以参考 Page Layout - Grid Customization :

2 Body Column
页面元素默认放置在文档的 body正文 区 :
::: {.column-body style="background:#adb5bd; color:white; text-align:center; border-radius:0.25rem;"}
.column-body
:::
如果需要可以使用 .column-body-outset, 使内容稍微延伸到正文区域外 :
::: {.column-body-outset style="background:#adb5bd; color:white; text-align:center; border-radius:0.25rem;"}
.column-body-outset
:::
3 Page Column
若需要更大的空间, 可以使用 .column-page , 让内容显著加宽到 page, 但不会延伸至整个屏幕的全宽 :
::: {.column-page style="background:#adb5bd; color:white; text-align:center; border-radius:0.25rem;"}
.column-page
:::
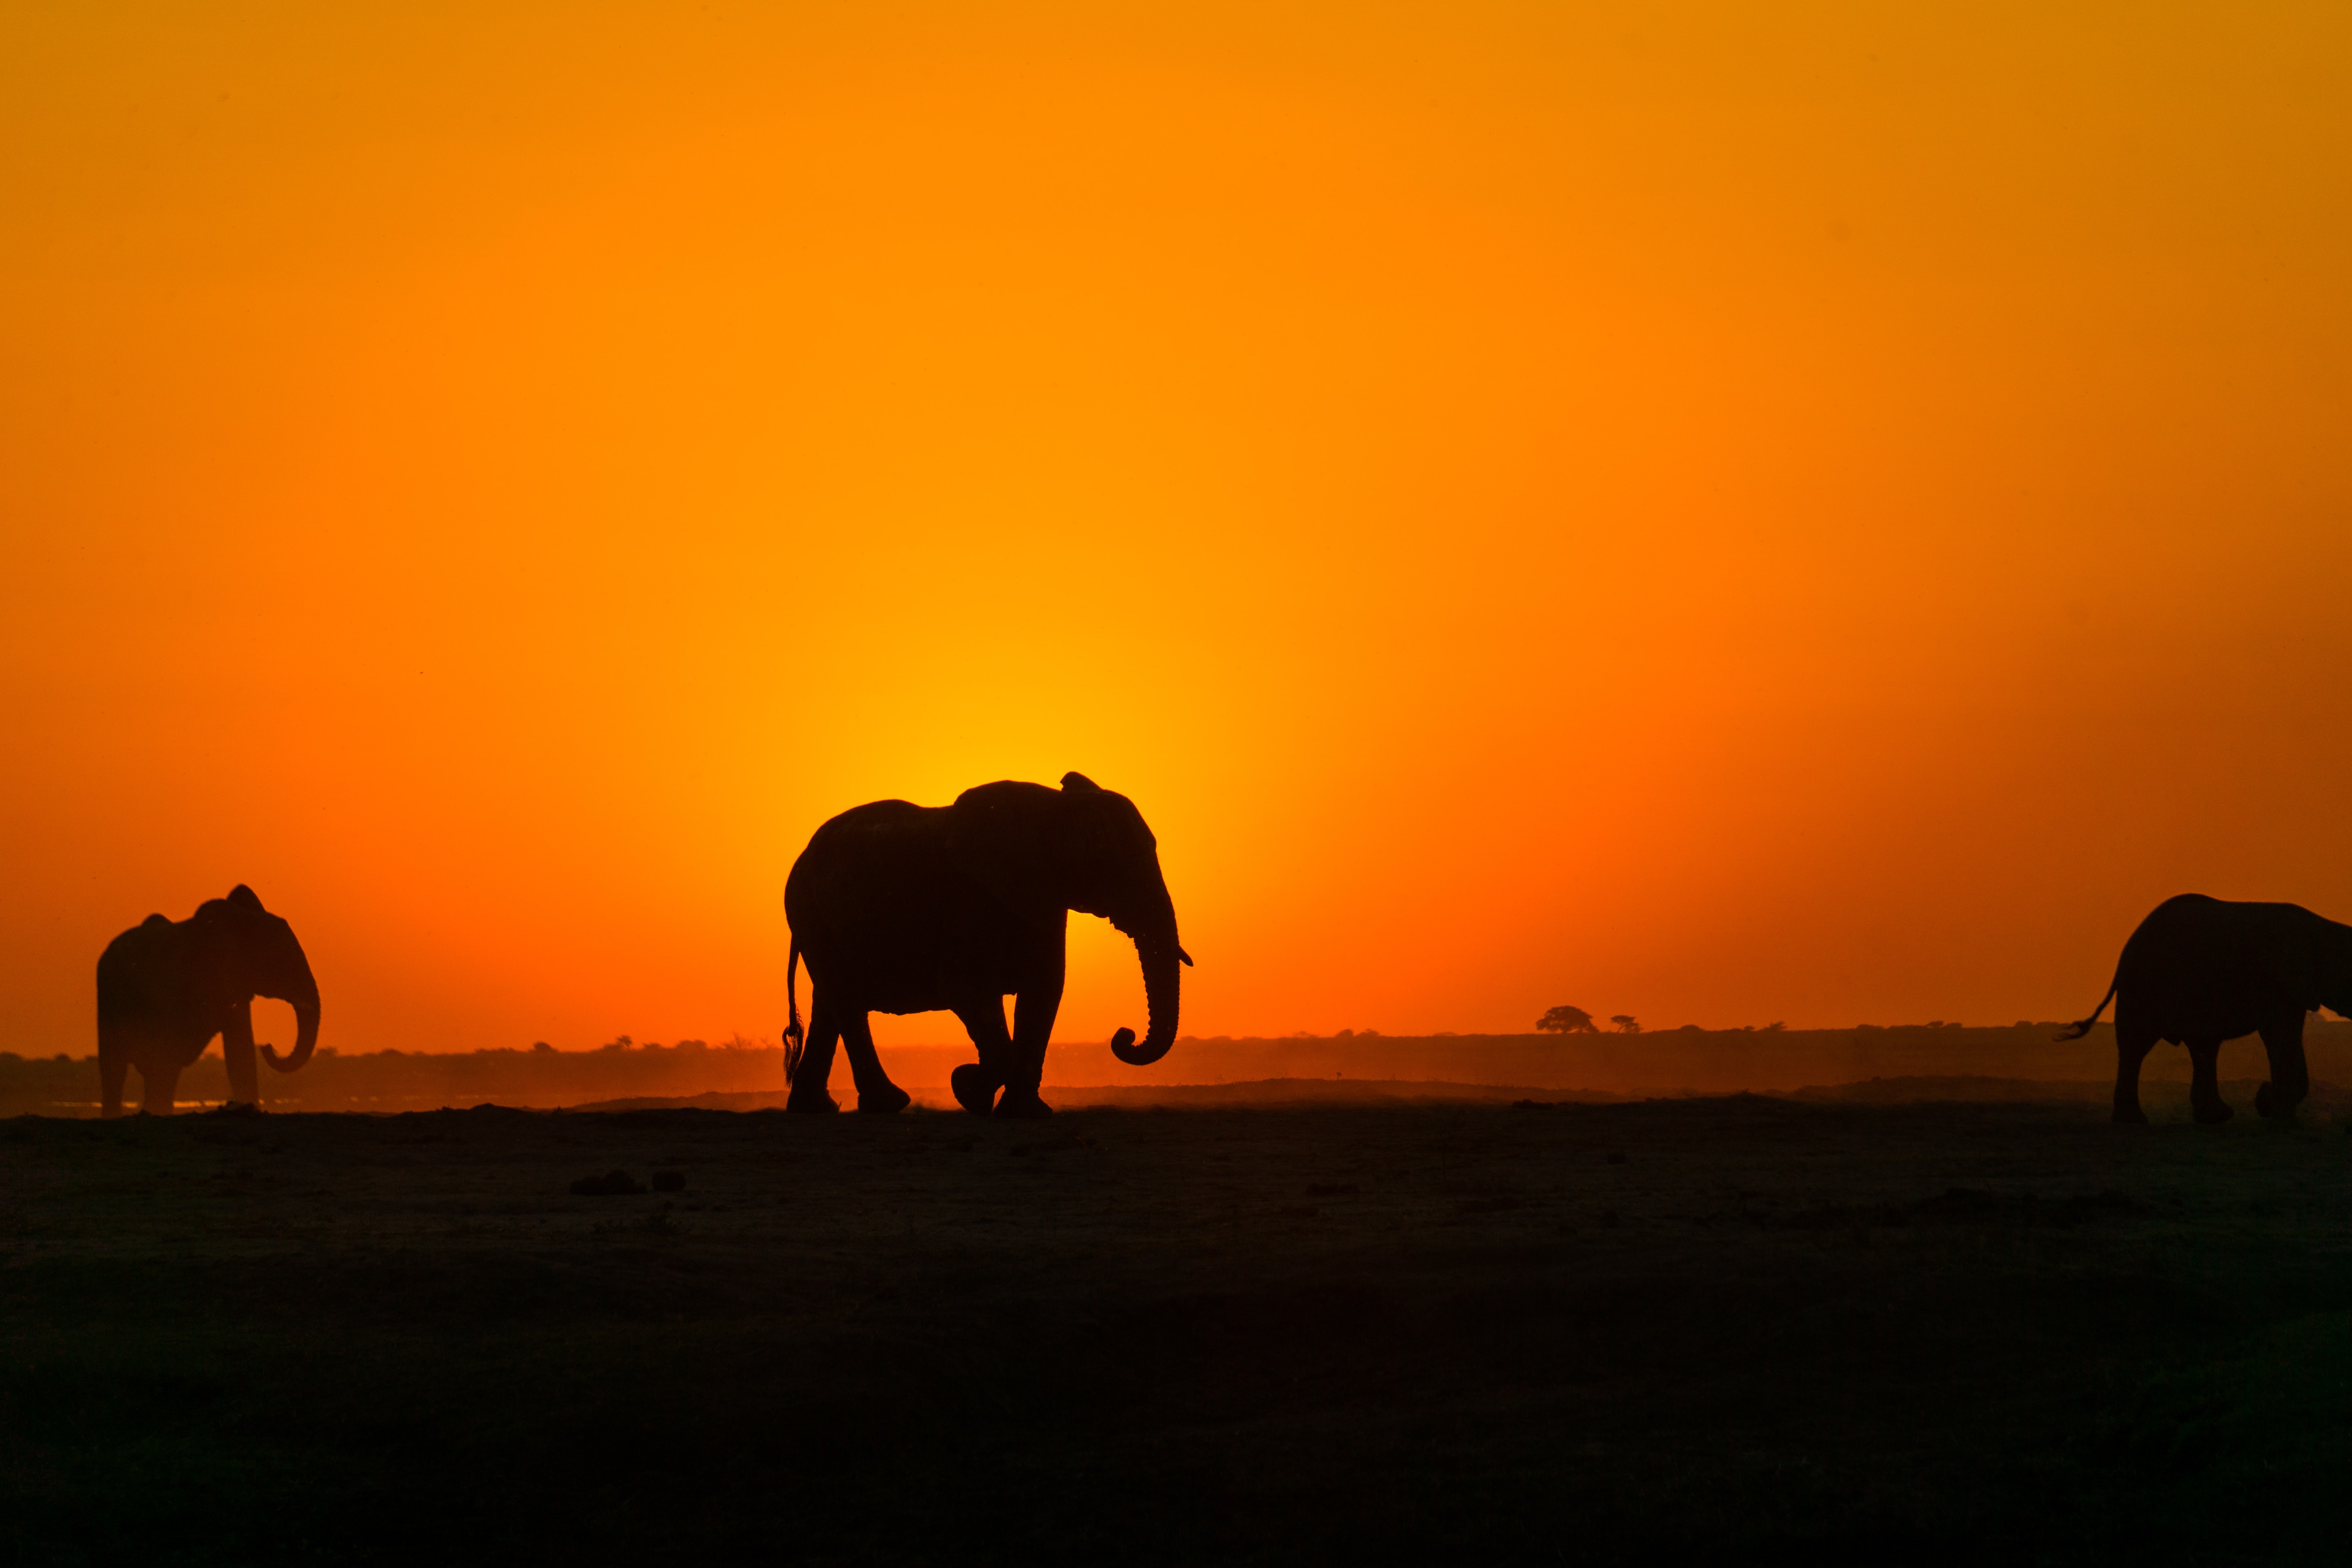
下面插入了一张非常宽的照片 :
::: column-page
:::
如果是代码块的输出, 可以在其YAML中指定占用 page 宽度 :
```{r}
#| column: page

knitr::kable(
  mtcars[1:6, 1:10]
)
```| mpg | cyl | disp | hp | drat | wt | qsec | vs | am | gear | |
|---|---|---|---|---|---|---|---|---|---|---|
| Mazda RX4 | 21.0 | 6 | 160 | 110 | 3.90 | 2.620 | 16.46 | 0 | 1 | 4 |
| Mazda RX4 Wag | 21.0 | 6 | 160 | 110 | 3.90 | 2.875 | 17.02 | 0 | 1 | 4 |
| Datsun 710 | 22.8 | 4 | 108 | 93 | 3.85 | 2.320 | 18.61 | 1 | 1 | 4 |
| Hornet 4 Drive | 21.4 | 6 | 258 | 110 | 3.08 | 3.215 | 19.44 | 1 | 0 | 3 |
| Hornet Sportabout | 18.7 | 8 | 360 | 175 | 3.15 | 3.440 | 17.02 | 0 | 0 | 3 |
| Valiant | 18.1 | 6 | 225 | 105 | 2.76 | 3.460 | 20.22 | 1 | 0 | 3 |
可以使用 .column-page-inset 让元素稍微内缩 :
::: {.column-page-inset style="background:#adb5bd; color:white; text-align:center; border-radius:0.25rem;"}
.column-page-inset
:::
4 Screen Column
内容可以占满整个 screen 宽度, 不留任何边距 :
::: {.column-screen style="background:#adb5bd; color:white; text-align:center; border-radius:0.25rem;"}
.column-screen
:::
下面展示了代码块中快递地图, 占用整个屏幕 :
```{r}
#| echo: false
#| out-width: "100%"
#| column: screen

library(leaflet)

leaflet(
  options = leafletOptions(
    crs       = leafletCRS("L.CRS.Simple"),  # 像素坐标系:图片即地图
    scrollWheelZoom = FALSE,
    minZoom   = -2, maxZoom = 2,
    zoomSnap  = 0.25, zoomDelta = 0.5,
    attributionControl = FALSE
  )
) |>
  htmlwidgets::onRender('
    function(el, x) {
      var W = 4400, H = 1772;
      var bounds = [[-H, 0], [0, W]];
      L.imageOverlay("Attachments/world-map.png", bounds).addTo(this);
      this.fitBounds(bounds);
      L.circleMarker([-604, 3643], {radius: 8, color: "#d33f49", fillOpacity: 1})
        .addTo(this)
        .bindPopup("");
    }')
```
5 Screen Inset
如果既要占满整个屏幕又希望留一点边距, 可以使用 .column-screen-inset :
::: {.column-screen-inset style="background:#adb5bd; color:white; text-align:center; border-radius:0.25rem;"}
.column-page-inset
:::
代码块中 screen-inset-shaded 会生成一个横跨整个屏幕并有浅色边的图表 :
```{r}
#| echo: false
#| out-width: "100%"
#| column: screen-inset-shaded

library(leaflet)

leaflet(
  options = leafletOptions(
    crs       = leafletCRS("L.CRS.Simple"),  # 像素坐标系:图片即地图
    scrollWheelZoom = FALSE,
    minZoom   = -2, maxZoom = 2,
    zoomSnap  = 0.25, zoomDelta = 0.5,
    attributionControl = FALSE
  )
) |>
  htmlwidgets::onRender('
    function(el, x) {
      var W = 4400, H = 1772;
      var bounds = [[-H, 0], [0, W]];
      L.imageOverlay("Attachments/world-map.png", bounds).addTo(this);
      this.fitBounds(bounds);
      L.circleMarker([-604, 3643], {radius: 8, color: "#d33f49", fillOpacity: 1})
        .addTo(this)
        .bindPopup("");
    }')
```
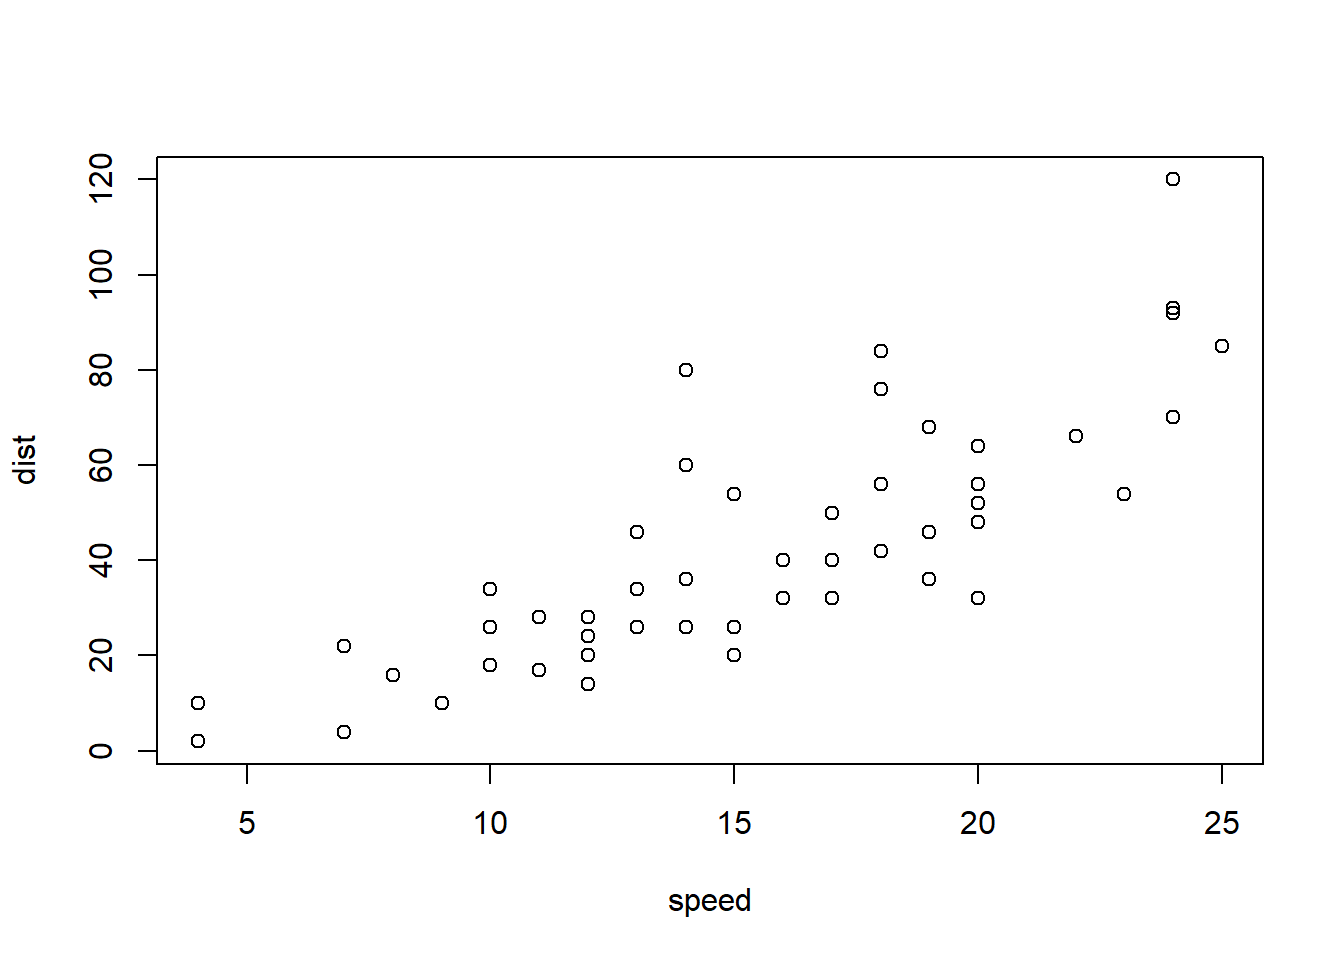
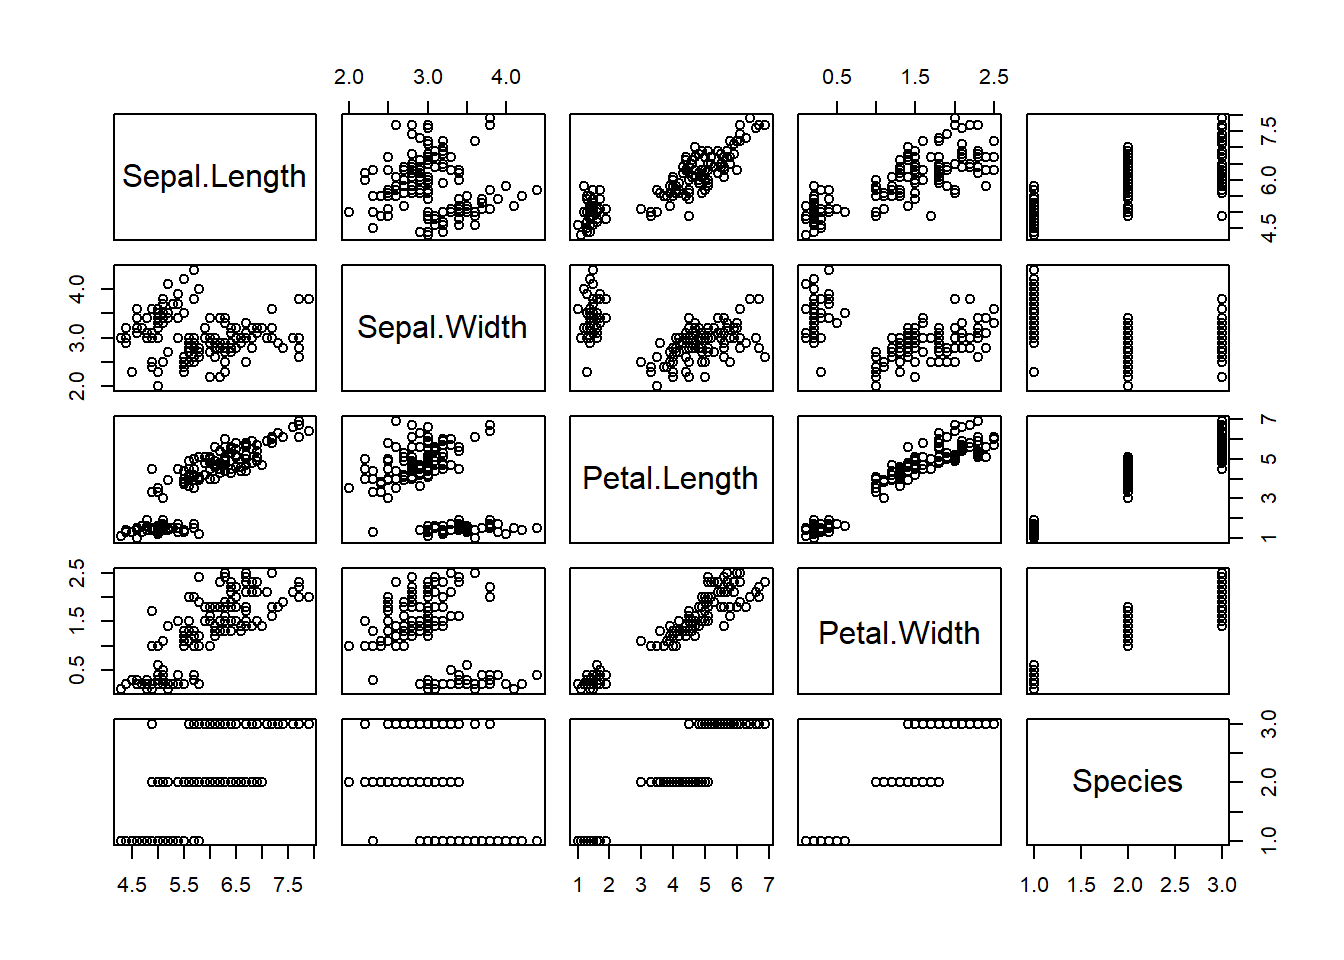
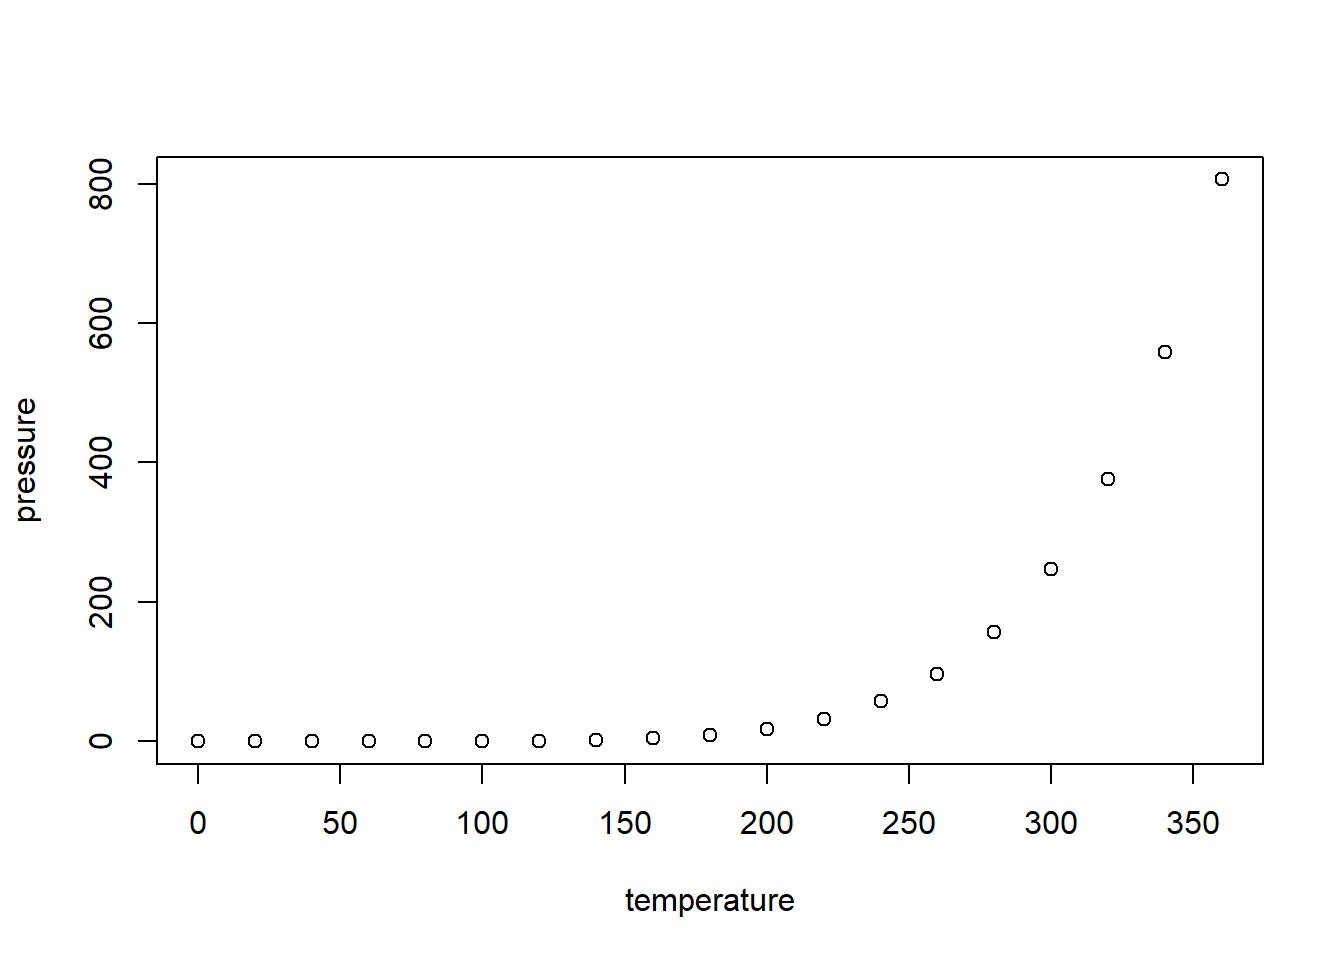
screen-inset-shaded 可以与高级图片布局配合使用。 下面是一个横跨整个页面的多列图表 :
```{r}
#| column: screen-inset-shaded
#| layout-nrow: 1
#| fig-alt:
#|   - "Scatterplot of stopping distance rising with car speed"
#|   - "Scatterplot matrix of the five iris variables"
#|   - "Scatterplot of vapor pressure rising steeply with temperature"

plot(cars)
plot(iris)
plot(pressure)
```
6 Margin Content 页边内容
可以将内容利用 .column-margin 放在右侧边距中, 下面围栏在右侧边距显示 :
::: {.column-margin style="background:#adb5bd; color:white; text-align:center; border-radius:0.25rem;"}
.column-margin
:::
也可以插入文本内容 :
根据 微积分第一基本定理 对于 \(x \in [a, b]\) 积分公式是 :
\[\frac{d}{dx}\left( \int_{a}^{x} f(u)\,du\right)=f(x).\]
::: {.column-margin}

根据 **微积分第一基本定理** 我们知道对于 $x$ 在区间 $[a, b]$ 积分公式是 :
$$\frac{d}{dx}\left( \int_{a}^{x} f(u)\,du\right)=f(x).$$
:::
7 Margin Figures 页边图形
选项 column: margin 可以让图形绘制在右侧页边距 margin :

```{r}
#| label: fig-mtcars
#| fig-cap: "MPG vs horsepower, colored by transmission."
#| fig-alt: "Scatterplot showing fuel economy falling as horsepower rises"
#| column: margin

library(ggplot2)
mtcars2 <- mtcars
mtcars2$am <- factor(
  mtcars$am, labels = c('automatic', 'manual')
)
ggplot(mtcars2, aes(hp, mpg, color = am)) +
  geom_point() +
  geom_smooth(formula = y ~ x, method = "loess") +
  theme(legend.position = 'bottom')
```
8 Margin Tables 页边表格
选项 column: margin 可以将表格绘制在右侧页边距 :
| mpg | cyl | disp | |
|---|---|---|---|
| Mazda RX4 | 21.0 | 6 | 160 |
| Mazda RX4 Wag | 21.0 | 6 | 160 |
| Datsun 710 | 22.8 | 4 | 108 |
| Hornet 4 Drive | 21.4 | 6 | 258 |
| Hornet Sportabout | 18.7 | 8 | 360 |
| Valiant | 18.1 | 6 | 225 |
```{r}
#| column: margin

knitr::kable(
  mtcars[1:6, 1:3]
)
```
9 多输出
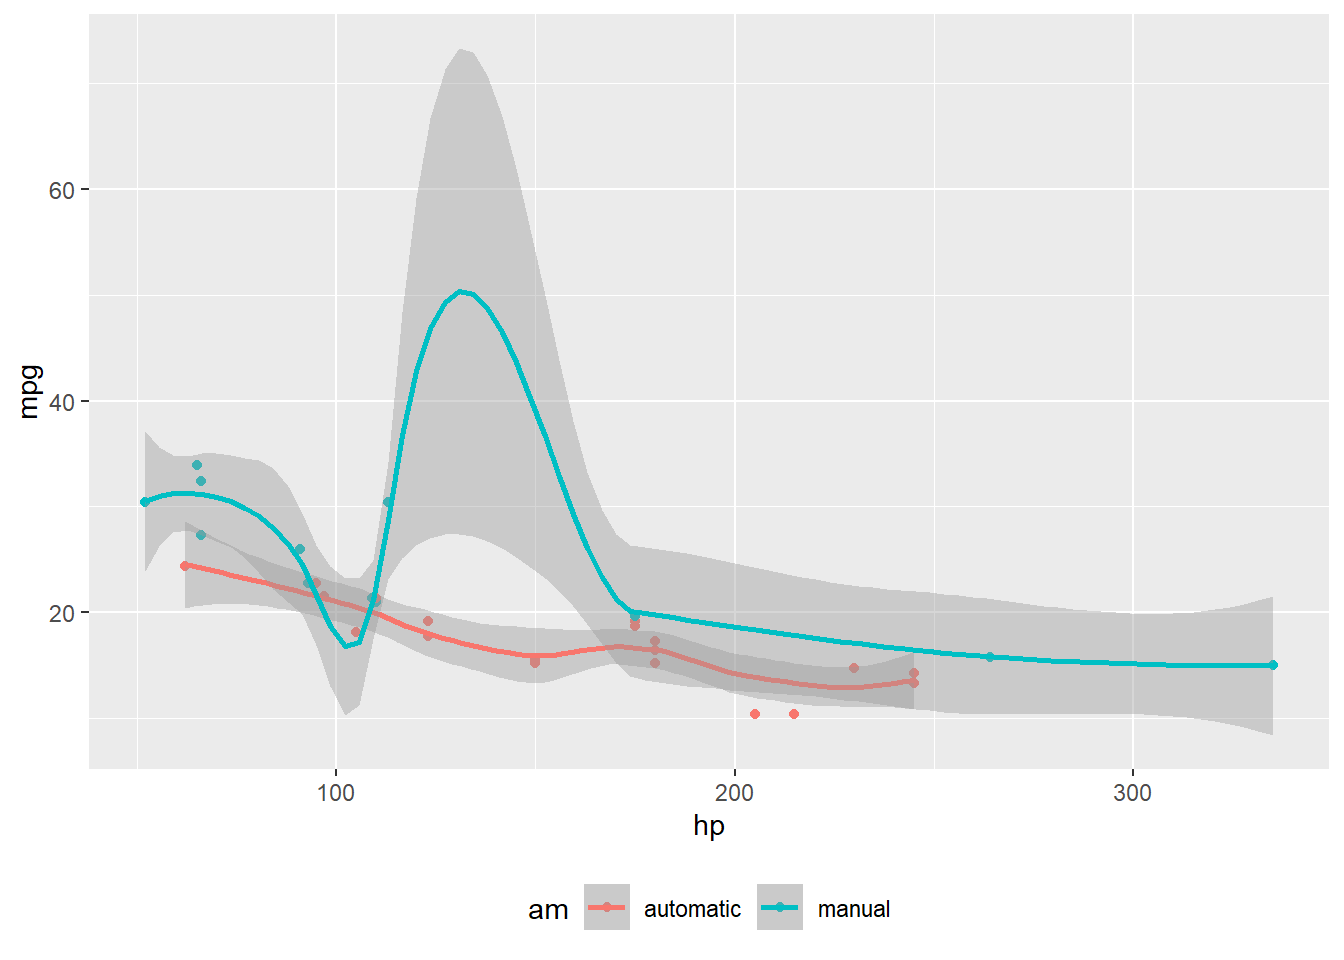
下面范例将图形利用 fig-column: margin 输出到页边距, 表格根据默认输出在正文 :
```{r}
#| fig-column: margin
#| fig-alt: "Scatterplot showing fuel economy falling as horsepower rises"

mtcars2 <- mtcars
mtcars2$am <- factor(
  mtcars$am, labels = c('automatic', 'manual')
)

knitr::kable(
  mtcars[1:6, 1:6]
)

library(ggplot2)
ggplot(mtcars2, aes(hp, mpg, color = am)) +
  geom_point() +
  geom_smooth(formula = y ~ x, method = "loess") +
  theme(legend.position = 'bottom')
```| mpg | cyl | disp | hp | drat | wt | |
|---|---|---|---|---|---|---|
| Mazda RX4 | 21.0 | 6 | 160 | 110 | 3.90 | 2.620 |
| Mazda RX4 Wag | 21.0 | 6 | 160 | 110 | 3.90 | 2.875 |
| Datsun 710 | 22.8 | 4 | 108 | 93 | 3.85 | 2.320 |
| Hornet 4 Drive | 21.4 | 6 | 258 | 110 | 3.08 | 3.215 |
| Hornet Sportabout | 18.7 | 8 | 360 | 175 | 3.15 | 3.440 |
| Valiant | 18.1 | 6 | 225 | 105 | 2.76 | 3.460 |
10 Page Breaks 分页符
插入 分页符 在浏览器中打印网页成 pdf 的时候会看到效果, 在浏览器里 Ctrl + P 打印预览, 在概述最后 Body Column 前可以看到效果 :
# 概述
省略的内容...

{{< pagebreak >}}

# Body Column
省略的内容...
11 Margin References 页边引用
可以通过设置文档 YAML1 将脚注和参考文献放在页边距 margin 中 :
1 本文的 YAML 已经设置了 reference-location: margin
---
reference-location: margin
citation-location: margin
---
下面是引用语法的一些简单介绍 :

12 Asides 旁注
旁注允许你将内容放在其所属正文内容的旁边 :
aside 类的 span,它会将内容放置在页面边缘,且不显示脚注编号。[这是一段带有 `aside` 类的 span,它会将内容放置在页面边缘,
且不显示脚注编号。]{.aside}13 Margin Captions 页边标题
对于图和表可以将内容保留在文档正文中,同时把标题放在文档的页边。可在代码单元或文档 YAML 元数据中使用 cap-location: margin 来控制这一行为 :

```{r}
#| label: fig-cap-margin
#| fig-cap: "两条曲线的标题被放在了页边"
#| fig-alt: "Scatterplot showing fuel economy falling as horsepower rises"
#| cap-location: margin

library(ggplot2)
mtcars2 <- mtcars
mtcars2$am <- factor(
  mtcars$am, labels = c('automatic', 'manual')
)
ggplot(mtcars2, aes(hp, mpg, color = am)) +
  geom_point() +
  geom_smooth(formula = y ~ x, method = "loess") +
  theme(legend.position = 'bottom')
```
14 Overflowing Content
通过使用 body、page、screen 的 right 和 left 版本,将内容扩展到正文区域之外的左侧或右侧 :
::: {.column-body-outset-right style="background:#adb5bd; color:white; text-align:center; border-radius:0.25rem;"}
.column-body-outset-right
:::
.column-body-outset-right
.column-page-inset-right
.column-page-right
.column-screen-inset-right
.column-screen-right
.column-body-outset-left
.column-page-inset-left
.column-page-left
.column-screen-inset-left
.column-screen-left
对于可执行代码单元,也可以通过 column 选项实现 :
```{r}
#| echo: false
#| out-width: "100%"
#| column: screen-inset-right

library(leaflet)

leaflet(
  options = leafletOptions(
    crs       = leafletCRS("L.CRS.Simple"),  # 像素坐标系:图片即地图
    scrollWheelZoom = FALSE,
    minZoom   = -2, maxZoom = 2,
    zoomSnap  = 0.25, zoomDelta = 0.5,
    attributionControl = FALSE
  )
) |>
  htmlwidgets::onRender('
    function(el, x) {
      var W = 4400, H = 1772;
      var bounds = [[-H, 0], [0, W]];
      L.imageOverlay("Attachments/world-map.png", bounds).addTo(this);
      this.fitBounds(bounds);
      L.circleMarker([-604, 3643], {radius: 8, color: "#d33f49", fillOpacity: 1})
        .addTo(this)
        .bindPopup("");
    }')
```